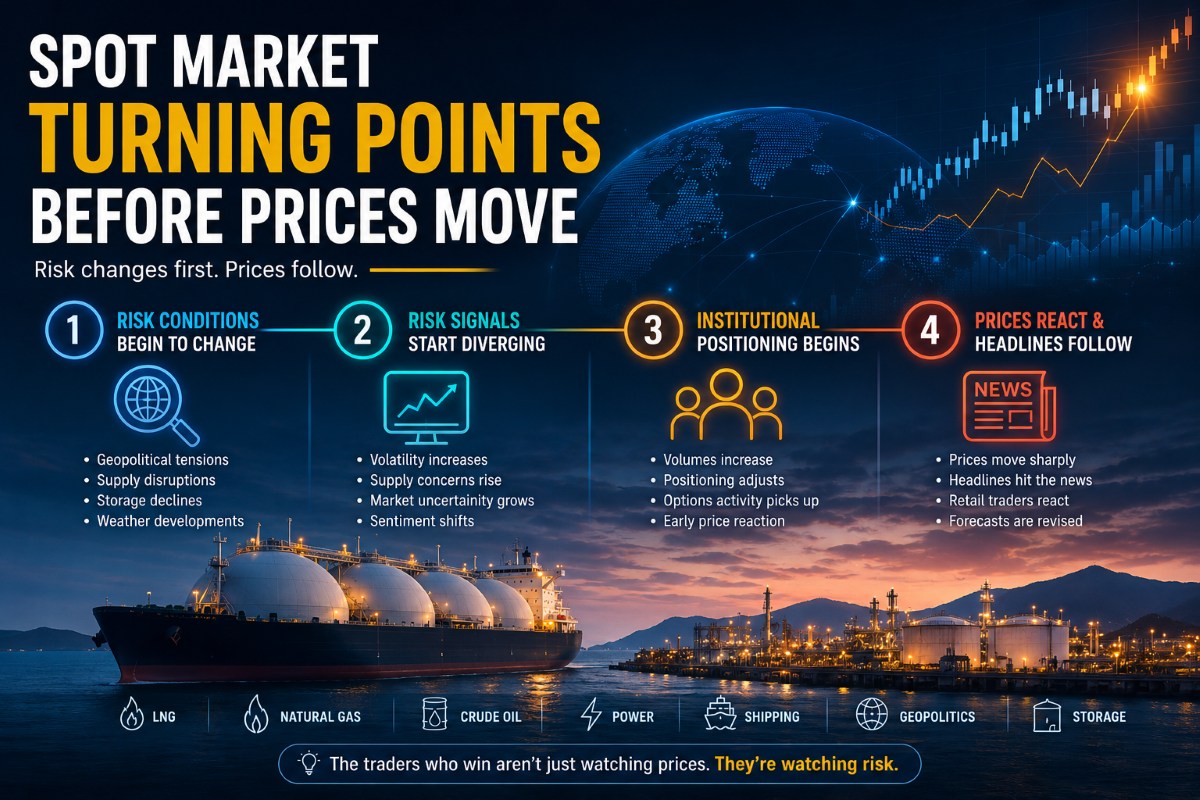
The hidden signals that often appear before LNG, natural gas, and oil markets change direction.
Most traders focus on one thing: price.
They monitor charts, track support and resistance levels, follow moving averages, and watch for breakouts. Yet some of the most significant moves in energy markets often begin long before they become visible on a price chart.
The reason is simple.
Markets do not move because prices change.
Prices move because market participants begin reacting to changes in risk.
For traders involved in LNG, natural gas, crude oil, power markets, and energy-related assets, identifying those risk changes early can provide a valuable edge.
The challenge is knowing what to look for.
Why Market Turning Points Often Start With Risk
Every major move in energy markets begins with a shift in expectations.
Before LNG prices rise, traders begin anticipating tighter supply.
Before oil prices fall, market participants may start expecting weaker demand.
Before volatility increases, uncertainty usually starts building beneath the surface.
The market is constantly attempting to price future conditions.
That means the earliest clues often come from changing risk conditions rather than from price itself.
By the time a headline reaches mainstream media, large institutions, commodity traders, and energy market participants may have already adjusted their positions.
This is why understanding risk can be just as important as understanding price.
The Four Stages of an Energy Market Turning Point
Most major energy market moves follow a similar pattern.
Stage 1: Risk Conditions Begin to Change
This is where everything starts.
Examples include:
- Escalating geopolitical tensions
- LNG supply disruptions
- Declining storage inventories
- Shipping route instability
- Production outages
- Unexpected weather developments
At this stage, prices may barely react.
In many cases, the broader market is not paying attention.
Stage 2: Risk Signals Start Diverging
As risk conditions evolve, underlying indicators often begin showing stress.
This may include:
- Rising volatility
- Increasing supply concerns
- Growing uncertainty among market participants
- Changes in market sentiment
- Emerging cross-market correlations
This is often where professional traders begin paying closer attention.
While the market narrative may still appear unchanged, the foundations underneath the market are shifting.
Stage 3: Institutional Positioning Begins
Large market participants rarely wait for headlines.
When risk conditions change significantly, positioning often begins before the broader market notices.
This can result in:
- Increased trading volumes
- Larger futures positioning adjustments
- Changes in options activity
- Shifts in physical market behavior
At this point, prices may begin showing early signs of movement.
However, the full market reaction has not yet arrived.
Stage 4: Prices React and Headlines Follow
Only after risk conditions have evolved and positioning has started do prices typically make a more visible move.
This is usually when:
- Financial media publishes major stories
- Social media discussions increase
- Retail traders become aware of the trend
- Analysts begin revising forecasts
Ironically, this is often when many traders first notice the opportunity.
For those monitoring risk, the signals may have been visible much earlier.
LNG Markets Provide a Perfect Example
Few markets demonstrate this process better than LNG.
Modern LNG trading is influenced by a complex network of interconnected risks.
A single event can affect:
- LNG cargo availability
- Shipping routes
- European gas storage
- Asian demand
- Natural gas benchmarks
- Power generation economics
For example, if geopolitical tensions threaten a major export region, traders may immediately begin evaluating potential supply implications.
If LNG cargoes become more difficult to source, European buyers may become more aggressive.
Storage refill expectations can change.
Price expectations begin shifting.
The actual price move may come days or weeks later.
The risk signal appeared first.
Why Price Charts Alone Are Not Enough
Technical analysis remains valuable.
Charts help traders identify trends, momentum, and market structure.
However, charts primarily show what has already happened.
Risk analysis helps explain what could happen next.
Consider two traders looking at the same natural gas chart.
Both see prices moving higher.
One trader sees only the price movement.
The other understands that:
- Storage inventories are tightening
- LNG supply flexibility is decreasing
- Geopolitical risks are increasing
- Market uncertainty is rising
The second trader possesses additional context.
That context can improve decision-making.
Not because it predicts the future with certainty, but because it provides a deeper understanding of the forces driving the market.
The Growing Importance of Risk Intelligence
Energy markets have become increasingly interconnected.
Today, an event in one region can quickly influence markets thousands of kilometers away.
A shipping disruption can affect LNG flows.
An LNG flow change can affect European gas balances.
European gas balances can influence power prices.
Power prices can impact industrial demand.
Everything is connected.
As a result, traders increasingly need more than just price data.
They need context.
They need to understand how different risks interact and how those risks may influence future market behavior.
This is where risk intelligence becomes valuable.
Instead of simply monitoring prices, traders can monitor the conditions that often drive those prices.
Looking Beyond the Headlines
One of the biggest mistakes traders make is reacting to news after the market has already processed it.
The most important question is often not:
"What happened?"
The more valuable question is:
"What risks are changing beneath the surface?"
By focusing on risk identification, traders can better understand:
- Why markets are moving
- Whether trends are strengthening or weakening
- Which risks deserve attention
- How market conditions may evolve
In an increasingly volatile energy environment, that understanding can become a meaningful advantage.
Final Thoughts
The energy market landscape is becoming more complex every year.
LNG, natural gas, oil, power markets, shipping, geopolitics, and energy security are now more interconnected than ever.
The traders who consistently succeed are not simply watching price.
They are watching risk.
Because market turning points rarely begin with a chart.
They usually begin with a change in risk conditions that most people have not noticed yet.
And by the time everyone notices, the market may have already moved.
Discussion
What is the earliest signal you monitor before entering an energy trade?
- Geopolitical developments?
- LNG flows?
- Storage levels?
- Price action?
- Weather forecasts?
- Risk indicators?
Share your thoughts in the comments.
The most valuable market insights often come from practitioners who see risks developing before the rest of the market does.