Global Energy Risk Index

Why GERI Exists

A Global Risk Index for a World Where Prices React Faster Than Reality

Markets move fast. Headlines move faster.
But systemic risk moves differently.

That's why we built GERI.

GERI (Global Energy Risk Index) is not a price, not a forecast, and not a headline feed. It is a daily risk regime signal that tells you whether global geopolitical and energy stress is building, peaking, or dissipating—before or after markets react.

The Problem With Watching Prices Alone

📈 Oil spikes
📉 Gas crashes
💥 Volatility explodes
🚢 Freight surges

Every day, markets shout: "Something is happening!"

But they don't answer the question that matters most:
Is this real systemic risk—or just short-term noise?

Prices react instantly.
Risk accumulates gradually.

Confusing the two leads to:

GERI was built to solve this gap.

What GERI Actually Measures

GERI aggregates global geopolitical and energy stress signals into a single, interpretable daily score (0–100), updated every day.

🔥

Escalation Intensity

How severe are current events?

🌍

Regional Concentration

Is risk spreading or localized?

Asset Exposure

Oil, gas, freight pressure

Persistence

Not panic—structural stress

GERI doesn't chase markets.
It measures whether stress is becoming structural.

Why GERI Looks Different From Oil, Gas, VIX, and Freight

This is where GERI proves its value.

🛢️ Oil Moves First. GERI Confirms (or Rejects).

Oil prices react quickly to headlines and sentiment. GERI rises only when those moves are supported by sustained geopolitical or energy pressure.

If oil spikes but GERI stays stable: The market may be overreacting.

If oil pulls back but GERI remains elevated: Risk hasn't actually gone away.

GERI vs Brent Oil comparison chart

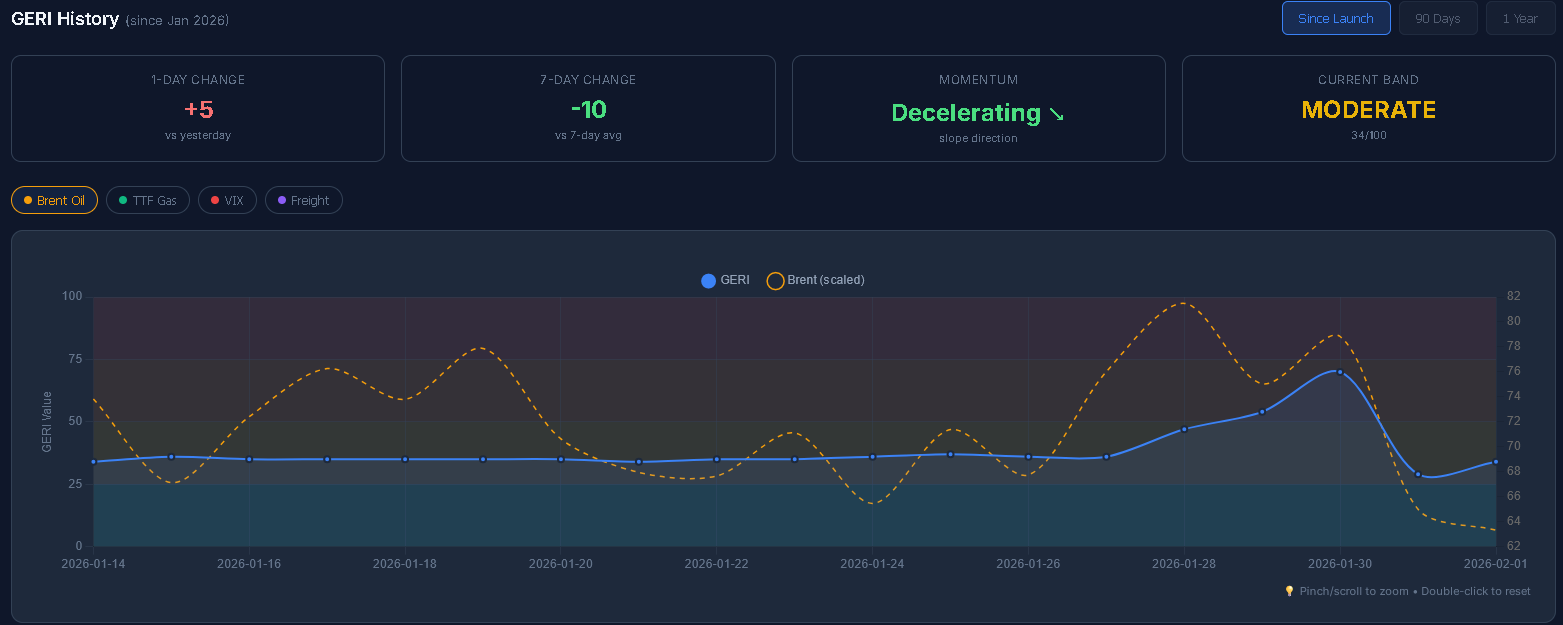
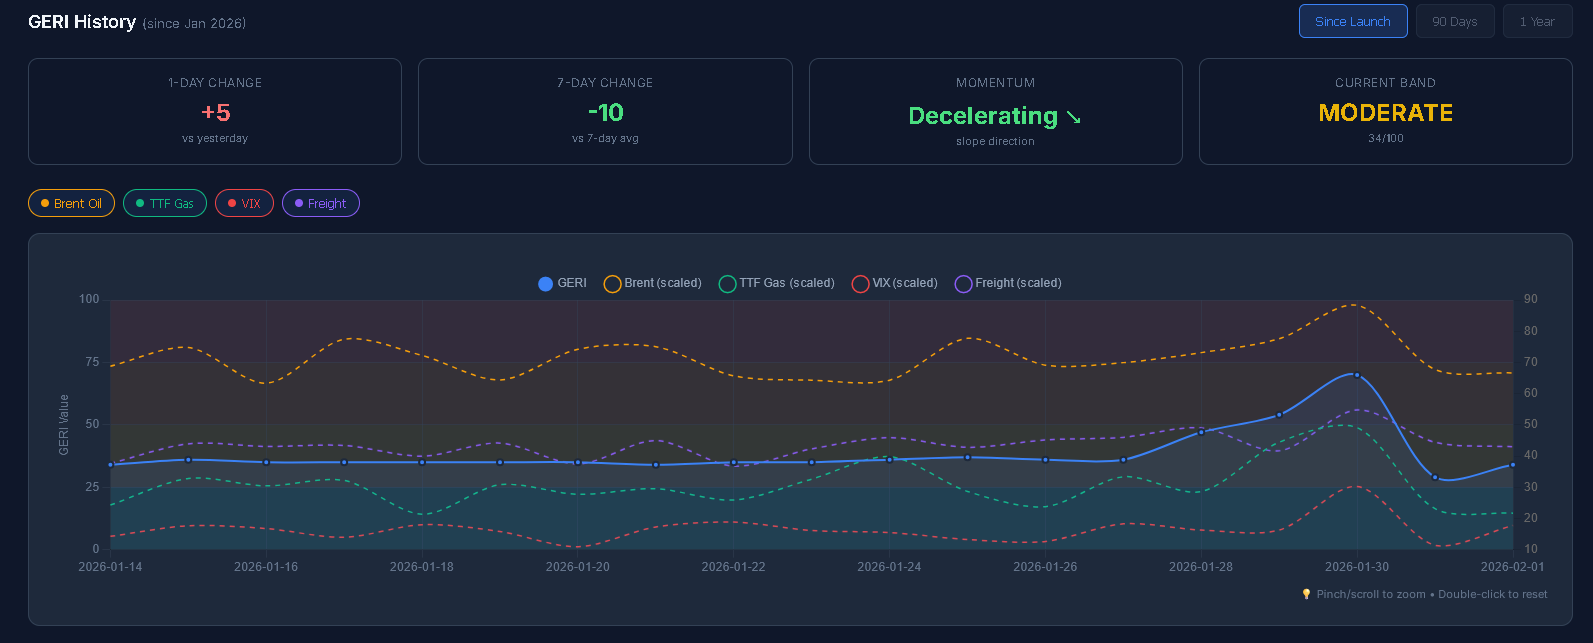
GERI (blue) vs Brent Oil (orange) - Notice how GERI moves more deliberately

🔥 Gas Is Local. GERI Is Global.

European gas prices are volatile by nature. They reflect regional stress, infrastructure constraints, and short-term flows.

GERI filters this: Local panic stays local.

Only contagious, cross-regional risk moves the index.

GERI vs TTF Gas comparison chart

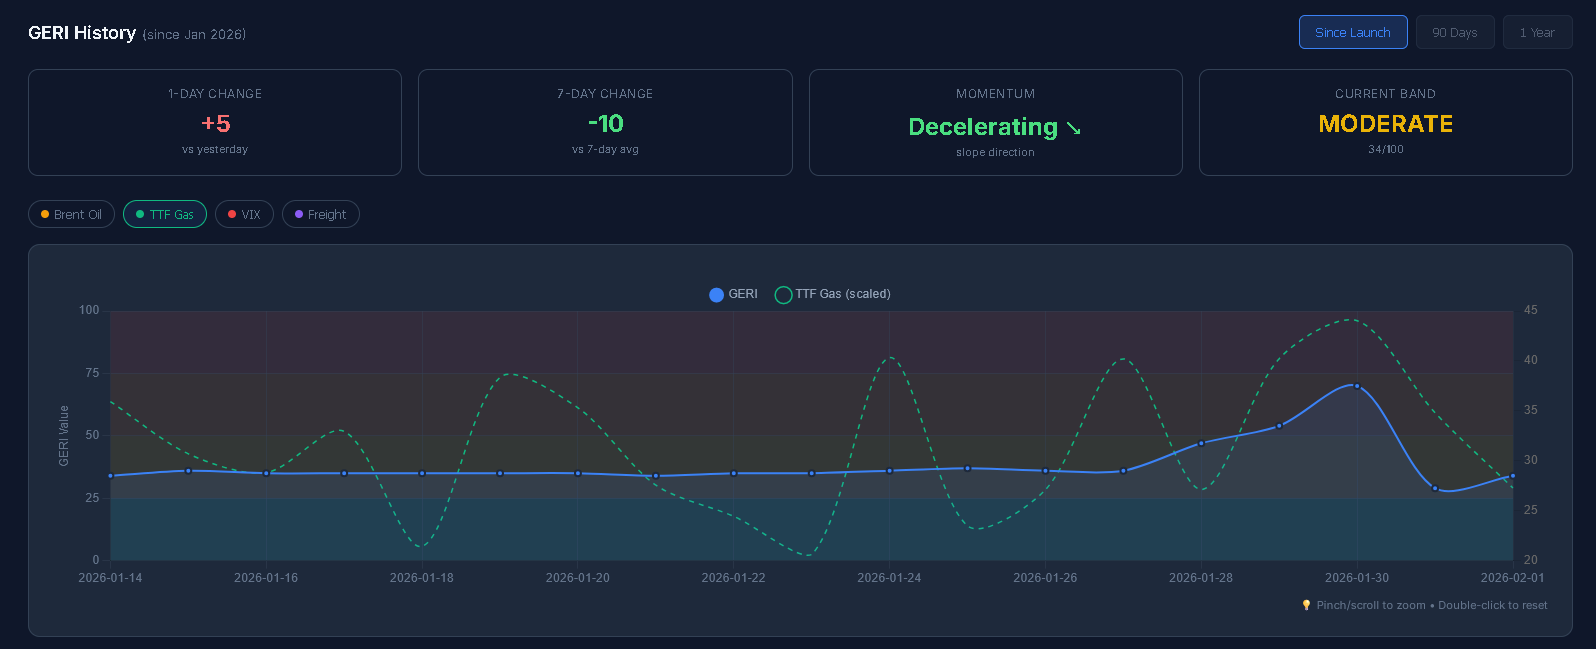
GERI (blue) vs TTF Gas (green) - Gas volatility filtered for global relevance

📊 VIX Measures Fear. GERI Measures Pressure.

Volatility spikes fast—and collapses just as fast. GERI behaves differently: it rises more slowly, peaks later, and stays elevated longer.

This is intentional. GERI reflects structural pressure, not emotional market reactions.

It often remains elevated after volatility fades, when risks still exist but markets feel calm again. That's where most mistakes happen.

GERI vs VIX comparison chart

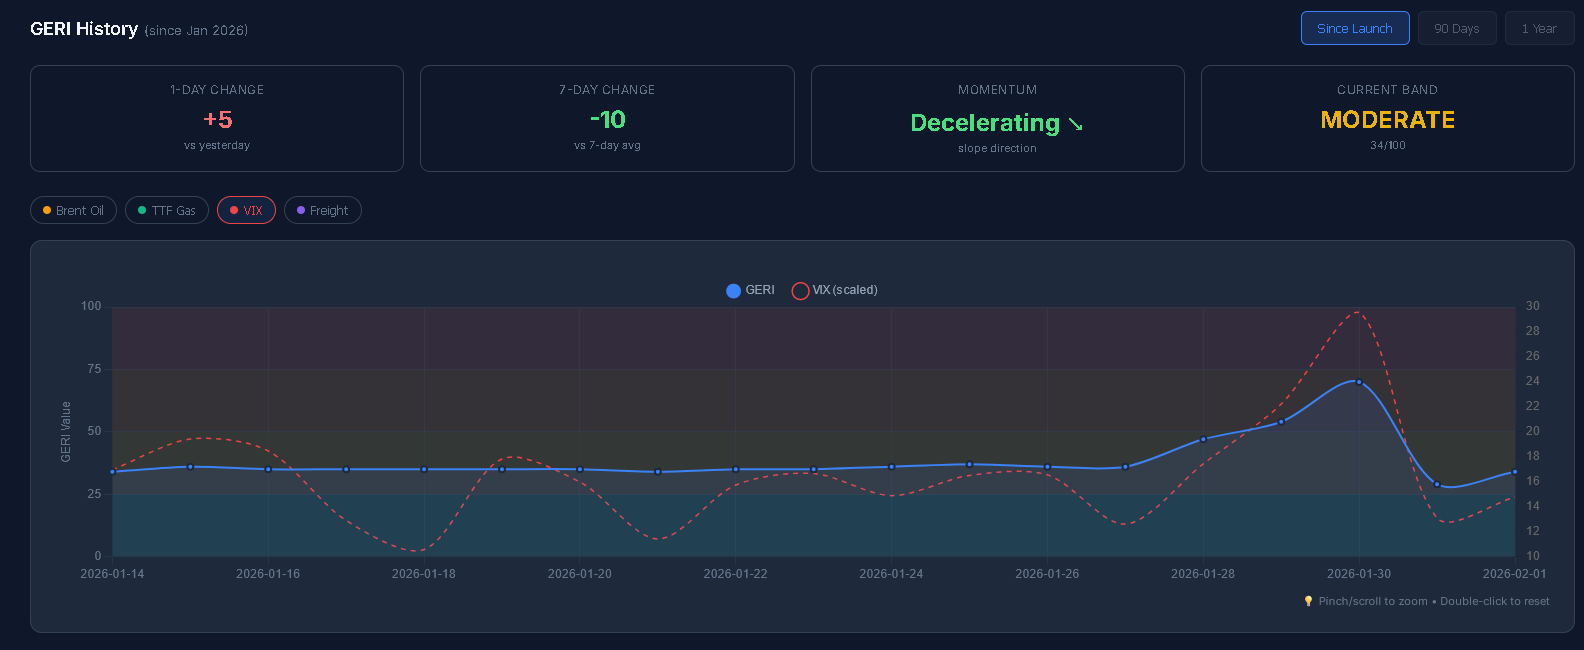
GERI (blue) vs VIX (red) - GERI stays elevated longer than volatility

🚢 Freight Breaks First. GERI Tells You If It Matters.

Freight reacts instantly to disruption. GERI tells you whether that disruption is temporary or systemic.

Not every shipping shock becomes a global risk event.
GERI highlights the ones that do.

GERI vs Freight comparison chart

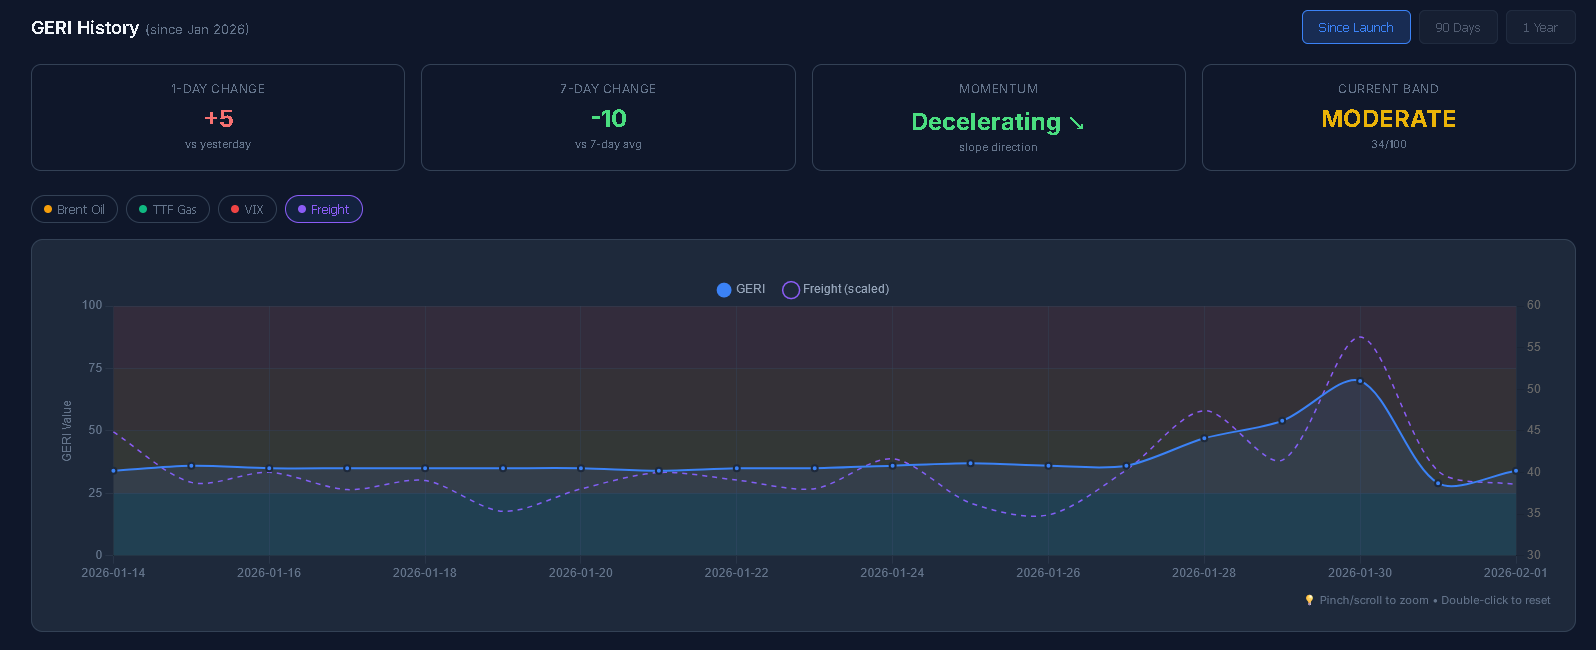
GERI (blue) vs Freight (purple) - Distinguishing noise from systemic disruption

The Pattern Professionals Care About

Across oil, gas, volatility, and freight, one pattern repeats:

Markets react first. GERI moves later—but more reliably.

That makes GERI ideal for:

Risk regime identification
Confirmation or rejection of market moves
Avoiding overreaction
Explaining decisions to stakeholders

GERI doesn't compete with prices.
It puts them in context.

What You Get With Live-GERI (Pro)

Pro subscribers unlock Live-GERI:

Latest Official GERI (No Delay)

Updated daily as soon as the index is computed. Public users see it later. You don't.

Full Risk Regime History (Since Launch)

Track how global risk evolves over time: rising, peaking, decelerating, stabilizing. No guessing. No memory bias.

Momentum & Trend Signals

Instantly see day-to-day change, 7-day trend, and acceleration vs deceleration. This turns GERI into a decision aid, not just a number.

Market Overlays (Oil, Gas, Volatility, Freight)

See how GERI behaves relative to markets, not instead of them. This is where insight happens.

Clear Risk Bands (LOW → CRITICAL)

GERI translates complexity into regimes you can act on. No interpretation gymnastics required.

Who Live-GERI Is Built For

Live-GERI is used by people who need to answer questions like:

"Are we entering a higher-risk regime?"

"Is this move justified—or just loud?"

"Should we de-risk now, or wait?"

"Why did we take (or avoid) this position?"

📊

Traders

🔍

Analysts

Energy Professionals

🛡️

Risk Managers

🌍

Macro Investors

📈

Portfolio Managers

What Live-GERI Is Not

To be clear, GERI is not:

A price prediction tool
A trading signal generator
A news feed
An AI hype product

It is something more useful:
A daily lens on global risk pressure.

Why Now

GERI is still early in its lifecycle.
That's an advantage—not a weakness.

By subscribing now, you:

Follow the index from its beginning
Build intuition as history grows
Lock in early access pricing
Stay ahead of public narratives

As history deepens, GERI becomes more powerful.
Early users benefit the most.

Start Using GERI the Way Professionals Do

Markets will always move. Headlines will always shout.
GERI tells you whether the world is actually becoming more dangerous—or just noisier.

Unlock Live-GERI today and start monitoring risk regimes, not just prices.

Get Live-GERI Access